You should spend about 20 minutes on this task.
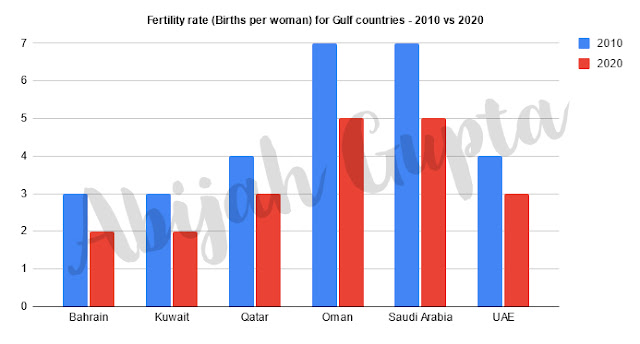
The chart below shows the fertility rate (Births per woman) for Gulf countries for the years 2010 and 2020.
|
The vertical bar chart shows the changes in the fertility rate of women in six Gulf countries - Saudi Arabia, the UAE, Oman, Qatar, Kuwait and Bahrain between 2010 and 2020. The data is reported in births per woman.
Firstly, we note an overall decline across all reported countries in the ten years. We also observe three pairs wherein the numbers and trends reported are the same for both years - Bahrain & Kuwait, Qatar & UAE, and Oman & Saudi Arabia.
While Saudi Arabia and Oman each reported seven births per woman in 2010, they saw a 33% reduction to five births within a decade. By contrast, Bahrain and Kuwait had the lowest rate at three each, eventually dropping to two. Qatar and UAE displayed similar trends, and both reported four births per woman in 2010 that declined to three by 2020.
Overall, there were significant decreases in birth rates in all Gulf countries, and Oman and Saudi Arabia had the highest fertility rate in both years.
IELTS Task 1 (Graphs) Sample Solutions
IELTS Task 2 (Essays) Sample Solutions

