You should spend about 20 minutes on this task.
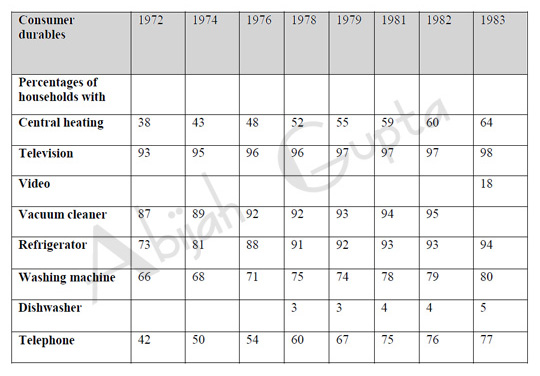
The table below shows the consumer durables (telephone, refrigerator, etcetera) owned in Britain from 1972 to 1983.
|
The tabular graph illustrates the percentage of British households who owned a range of consumer durables between 1972 and 1983.
The most significant increase was telephone ownership, rising from 42% in 1972 to 77% in 1983. At 98%, almost all households owned a Television by 1983, closely followed by Refrigerators at 94%. Unlike its counterparts, the least popular durable was a Dishwasher, stagnating at an average of 5% between 1978 and 1983.
In 1983, with the introduction of Video equipment, 18% of households reported ownership. Over nine years, the proportion of British houses with central heating rose from one-third to nearly two-thirds. In the reported period of less than a decade, an increased purchasing power fueled by affordability and relentless marketing strategies could have led to the visibly significant increases in the ownership of all reported consumer durables.
To summarize, it is apparent that the percentage of durables ownership increased over the years.
IELTS Task 1 (Graphs) Sample Solutions
IELTS Task 2 (Essays) Sample Solutions

