You should spend about 20 minutes on this task.
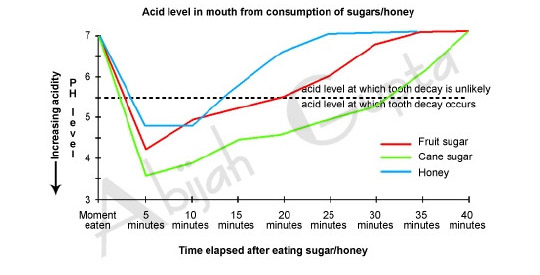
The chart below shows the acid level in the mouth from consumption of sweets.
|
The polyline graph illustrates the acid level in the mouth after consuming sugars or honey. The data is calibrated from a scale ranging from the moment eaten to 40 minutes.
When the PH level in the mouth is above 5.5, acidity is such that teeth are unlikely to be in danger of decay. By comparing fruit sugar, cane sugar and honey, we find that cane sugar lowers PH levels for the longest period, thus producing the most significant risk of tooth decay. Approximately five minutes after consuming cane sugar, PH levels drop to as low as PH 3.5. They begin to rise slowly but do not rise above PH 5.5 until at least 30 minutes have elapsed.
By contrast, fruit sugar, which causes the mouth's acidity to fall just above 4, poses a danger for a shorter period, and tooth decay is unlikely 20 minutes after consumption. Honey appears an even less risky substance. Though acidity falls to about pH 4.75 within five minutes of consumption, it returns to above PH 5.5 in under fifteen minutes.
Overall, it is apparent that fruit sugar or honey is preferable to cane sugar.
IELTS Task 1 (Graphs) Sample Solutions
IELTS Task 2 (Essays) Sample Solutions

