You should spend about 20 minutes on this task.
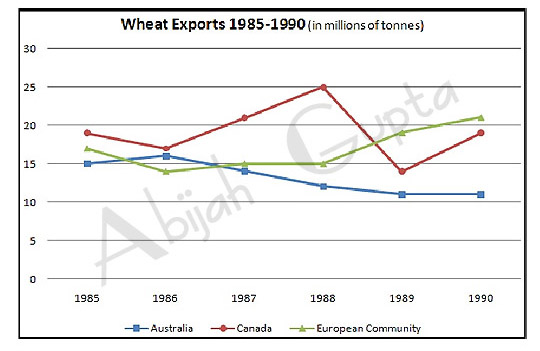
The chart below shows the differences in wheat exports for three regions from 1985 - 1990.
|
The polyline graph depicts the wheat exports for Australia, Canada and the European community from 1985-1990. The data is reported in millions of tonnes.
In 1985, Australia exported about 15 million tonnes of wheat and the following year the number increased by an additional one million tonnes. After that, however, there was a gradual drop until 1989 and onwards when it stabilized at about 11 million tonnes.
Over the same period, Canadian export quantity varied greatly. It started at 19 million tonnes in 1985, reached a peak in 1988 of 24 million, dropped dramatically in 1989 to 14 million tonnes and then climbed back to 19 million in 1990.
The European community exported seventeen million tonnes in 1985, which decreased to roughly 15 million tonnes for about two years. Starting in 1988, it steadily climbed and surpassed Canada.
Overall, exports from Australia declined over the five years, while the Canadian market fluctuated considerably, and the European Community showed an increase.
IELTS Task 1 (Graphs) Sample Solutions
IELTS Task 2 (Essays) Sample Solutions

