You should spend about 20 minutes on this task.
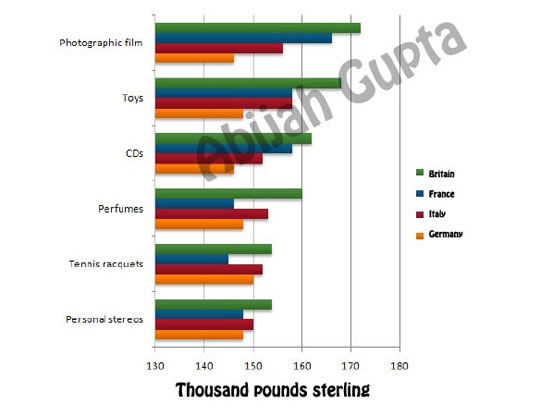
The chart below shows the amount spent on six consumer goods in four countries.
|
The horizontal bar graph depicts the expenditure on six consumer goods in four European countries. The data is reported in Thousand pounds sterling.
From an overall perspective, it is observable that Britain was the leading country out of the four countries in terms of expenditure on all six different consumer goods. Britain's maximum expenditure was on Photographic film at approximately 172, closely followed by Toys and CDs at 168 each. It spent an identical amount on Tennis racquets and Personal stereos. France's maximum expenditure was on Photographic film, and it spent an equal amount on Toys and CDs at 158. It spent the least on Tennis racquets.
Moving further, it is observable that Italy's expenditure has always been more than Germany in all consumer goods categories. Italy spent the maximum on Toys closely followed by Photographic film and the least on Personal stereos at 150. Germany spent the most on Tennis racquets and the least amounts on Photographic film and CDs.
In a nutshell, out of the mentioned countries, Britain has always spent the most on consumer goods.
IELTS Task 1 (Graphs) Sample Solutions
IELTS Task 2 (Essays) Sample Solutions

