Showing posts with label Table graph. Show all posts

Tuesday, January 25, 2022

IELTS Task 1: Table Chart: Cosumer durables owned in Britain

WRITING TASK 1

You should spend about 20 minutes on this task.

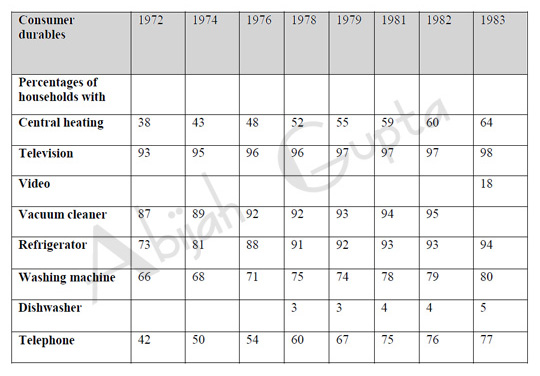
The table below shows the consumer durables (telephone, refrigerator, etcetera) owned in Britain from 1972 to 1983.


Summarise the information by selecting and reporting the main features, and make comparisons where relevant.


consumer durables owned in Britain
The tabular graph illustrates the percentage of British households who owned a range of consumer durables between 1972 and 1983.

The most significant increase was telephone ownership, rising from 42% in 1972 to 77% in 1983. At 98%, almost all households owned a Television by 1983, closely followed by Refrigerators at 94%. Unlike its counterparts, the least popular durable was a Dishwasher, stagnating at an average of 5% between 1978 and 1983.

In 1983, with the introduction of Video equipment, 18% of households reported ownership. Over nine years, the proportion of British houses with central heating rose from one-third to nearly two-thirds. In the reported period of less than a decade, an increased purchasing power fueled by affordability and relentless marketing strategies could have led to the visibly significant increases in the ownership of all reported consumer durables.

To summarize, it is apparent that the percentage of durables ownership increased over the years.

IELTS Task 1 (Graphs) Sample Solutions

IELTS Task 2 (Essays) Sample Solutions

Sunday, January 23, 2022

IELTS Task 1 - Table Chart: UK Residents travel abroad

WRITING TASK 1

You should spend about 20 minutes on this task.

The chart below shows the results of a survey on visits abroad and the destinations by the UK residents.


Summarise the information by selecting and reporting the main features, and make comparisons where relevant.


Visits abroad by UK residents

The two tabular charts depict the visits abroad by UK residents by the purpose of visit and the destinations of visits for the years 1994 to 1998.

At first glance, we observe that holiday trips were the leading reason for travelling abroad in all the five years followed by business and visits to friends and relatives. After a slight overall pullback in 1995, there was an approximate 30% increase in the holiday visits till 1998 while for other purposes the figures rose slightly. The maximum number of visits abroad by UK residents was in 1998.

Moving further, Western Europe was the favourite destination for UK residents travelling abroad, and the figure jumped by approximately 25% in 5 years. Visits to North America doubled from 919 to 1823 from 1994 to 1998.

Overall, the biggest reason for visits abroad was holidays, and the favourite destination was Western Europe.

IELTS Task 1 (Graphs) Sample Solutions

IELTS Task 2 (Essays) Sample Solutions

IELTS Task 1 - Table Graph: Favourite pastimes by countries

WRITING TASK 1

You should spend about 20 minutes on this task.

The chart below shows the favourite pastimes in different countries.


Summarise the information by selecting and reporting the main features, and make comparisons where relevant.

Favourite pastimes by countries
The tabular graph vividly depicts and compares the favourite pastimes in eight countries.

From the first glance, according to totals, it is evident that Reading is the most preferred pastime for all eight countries, with Japan having the highest preference. The lowest preferred pastime is sleeping.

About 60% of Canadians, Australians and Americans prefer watching television. On the other hand, this figure is relatively low for China, where only 15% watch television. Americans like music at 23%; however, only 2 to 5% of people in the other countries feel the same way.

20% of people in England enjoy sleeping as a pastime whereas only 2% in Canada and the USA. The Chinese like hobbies the most at 50% compared to only 20% in France. The highest percentage of beach-lovers is in Australia and the USA at 30% each.

Overall, it is apparent from the graph that while the other seven countries have diverse tastes, Japan's only favourite pastime is Reading.

IELTS Task 1 (Graphs) Sample Solutions

IELTS Task 2 (Essays) Sample Solutions